Recurring Donor Benchmarks: How Many Times Do People Give?
We analyzed data from thousands of nonprofits to uncover how donor retention really varies by cause—and what one extra donation per person could mean for your bottom line.


Picture this: You’ve finally convinced a supporter to set up a recurring donation. You celebrate, maybe breathe a sigh of relief. But months later, their gift quietly stops. What happened? Was it your last newsletter? A missed thank you? Or is this just how donor relationships work?
If you’ve ever wondered if your donor journey is “normal,” you’re not alone. Every nonprofit leader wants to know how long recurring donors typically stay engaged. And until now, it’s been tricky to get a clear, apples-to-apples view of what’s typical for your cause.
Note: These benchmarks are based on anonymized recurring donation data from thousands of nonprofits using Zeffy. Every organization is different—use this data as a reference, not a final grade.
Unsure of your donor retention rate? See this article for an easy calculation!
The Big Picture: What We Found
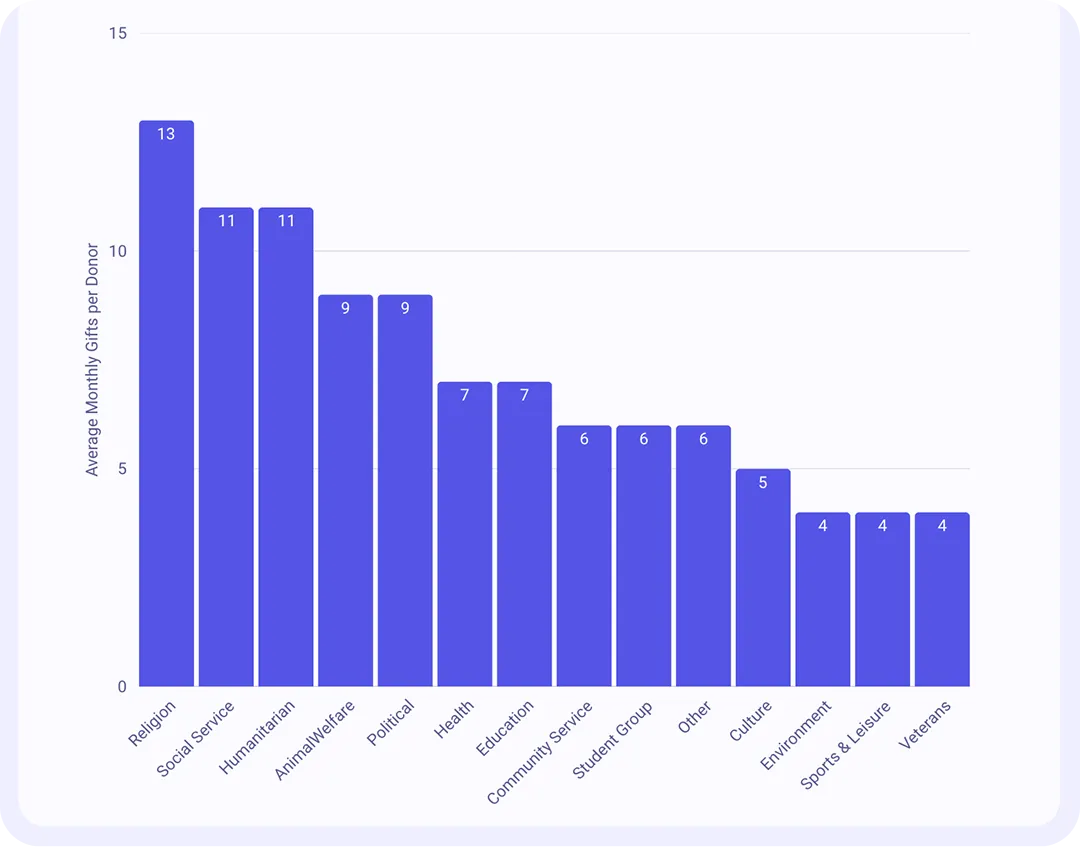
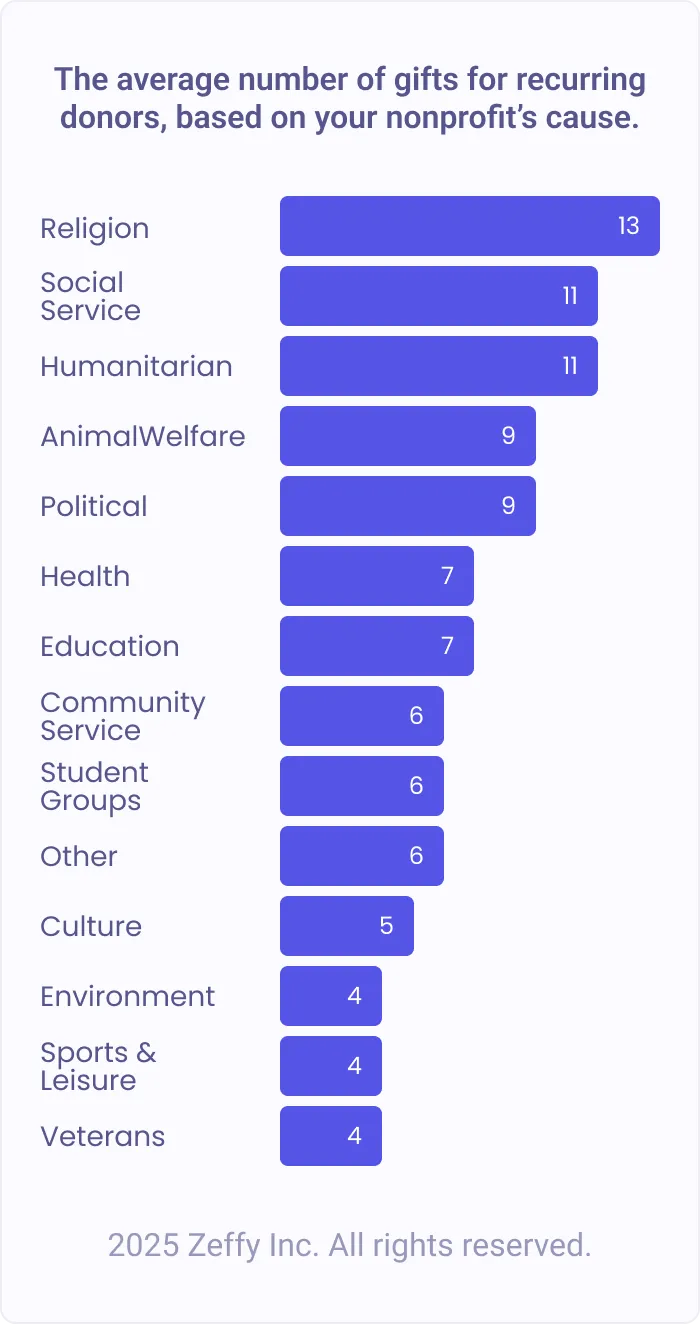
The chart above shows the average number of donations made by recurring donors across different nonprofit causes.
Here’s the reality: Most recurring donors don’t stick around forever, but some causes hold on to them longer than others. Understanding these patterns can help you set realistic expectations and focus your retention efforts where they’ll make the biggest impact.
Breaking Down the Numbers: Who Gives the Most Often
Looking closer at these donation patterns, we see three distinct tiers:
Top Tier (9-13 donations per donor)
- Religious organizations (13) maintain the longest relationships, likely due to strong community ties and regular engagement through services and events.
- Social Service and Humanitarian causes (11) follow closely behind, suggesting donors feel a lasting connection to these missions.
- Animal Welfare and Political organizations (9) round out the top performers, with donors making nearly twice as many gifts as the lowest tier.
Middle Tier (5-7 donations per donor)
- Health and Education organizations (7) show steady engagement, with donors likely supporting specific programs or ongoing needs.
- Community Service, Student Groups, and Other causes (6) follow closely behind, reflecting a mix of mission-driven support and shorter-term involvement.
Lower Tier (4 donations per donor)
- Veterans, Environment, and Sports & Leisure organizations (4) tend to have shorter relationships, possibly because these causes may attract more event-driven or campaign-specific support.
The difference is big: Religious organizations receive over three times as many donations per recurring donor compared to Veterans, Environment, and Sports & Leisure causes.
The Growing Importance of Recurring Giving
GivingTuesday reports that the share of donors giving monthly has nearly doubled over the past five years, from 3.76% in 2019 to 6.23% in 2024. But the percentage of new donors who start as recurring givers has stayed mostly flat at just under 2%.
That gap matters. According to GivingTuesday, nonprofits could unlock $10–20 billion more in giving annually if even a small portion of new donors began as recurring givers.
This adds important context to what we're seeing in Zeffy's data: the average number of donations varies significantly by cause, but every additional donation represents more stable support for your mission. Even small improvements in donor retention can have a big impact on your organization's financial sustainability.
And if you can figure out a way to improve donor retention rates and increase your average number of donations per donor? That's the million-dollar question.
Recurring giving doesn't work for everyone, but when it does, it can be a powerful way to build lasting relationships. Even small shifts in how new donors engage could have a big impact sector-wide.
How Zeffy Helps with Donor Retention
Zeffy is built to help you hold onto donors longer, without creating more work. Here’s how:
Zeffy helps you build loyalty, reduce admin work, and keep the support flowing, all 100% fee-free.
How We Got These Numbers
Our analysis covers all recurring donor transactions up to September 13, 2024. We only looked at donors with automatic, repeating gifts—these numbers don't include one-time donors.
We calculated the average number of donations made by recurring donors across different organization causes. This helps us compare all kinds of nonprofits, no matter how often their donors give.
We count unique donor transactions, so each donor (or each recurring donation series) is only counted once.
The data is summarized by organization cause (like Health, Education, etc.), but we don't split by specific donor ages, gift sizes, or organization sizes. This means the patterns you see represent averages across many organizations of different sizes and donor demographics.
Disclaimer:
The benchmark data presented reflects aggregated industry averages and is intended for general informational purposes only. Individual organization performance may vary due to numerous factors, including but not limited to mission focus, donor demographics, fundraising strategies, and external market conditions. Deviations from these benchmarks should not be interpreted as indicative of Zeffy’s platform performance or efficacy.
Picture this: You’ve finally convinced a supporter to set up a recurring donation. You celebrate, maybe breathe a sigh of relief. But months later, their gift quietly stops. What happened? Was it your last newsletter? A missed thank you? Or is this just how donor relationships work?
If you’ve ever wondered if your donor journey is “normal,” you’re not alone. Every nonprofit leader wants to know how long recurring donors typically stay engaged. And until now, it’s been tricky to get a clear, apples-to-apples view of what’s typical for your cause.
Note: These benchmarks are based on anonymized recurring donation data from thousands of nonprofits using Zeffy. Every organization is different—use this data as a reference, not a final grade.
Unsure of your donor retention rate? See this article for an easy calculation!
The Big Picture: What We Found
The chart above shows the average number of donations made by recurring donors across different nonprofit causes.
Here’s the reality: Most recurring donors don’t stick around forever, but some causes hold on to them longer than others. Understanding these patterns can help you set realistic expectations and focus your retention efforts where they’ll make the biggest impact.
Breaking Down the Numbers: Who Gives the Most Often
Looking closer at these donation patterns, we see three distinct tiers:
Top Tier (9-13 donations per donor)
- Religious organizations (13) maintain the longest relationships, likely due to strong community ties and regular engagement through services and events.
- Social Service and Humanitarian causes (11) follow closely behind, suggesting donors feel a lasting connection to these missions.
- Animal Welfare and Political organizations (9) round out the top performers, with donors making nearly twice as many gifts as the lowest tier.
Middle Tier (5-7 donations per donor)
- Health and Education organizations (7) show steady engagement, with donors likely supporting specific programs or ongoing needs.
- Community Service, Student Groups, and Other causes (6) follow closely behind, reflecting a mix of mission-driven support and shorter-term involvement.
Lower Tier (4 donations per donor)
- Veterans, Environment, and Sports & Leisure organizations (4) tend to have shorter relationships, possibly because these causes may attract more event-driven or campaign-specific support.
The difference is big: Religious organizations receive over three times as many donations per recurring donor compared to Veterans, Environment, and Sports & Leisure causes.
The Growing Importance of Recurring Giving
GivingTuesday reports that the share of donors giving monthly has nearly doubled over the past five years, from 3.76% in 2019 to 6.23% in 2024. But the percentage of new donors who start as recurring givers has stayed mostly flat at just under 2%.
That gap matters. According to GivingTuesday, nonprofits could unlock $10–20 billion more in giving annually if even a small portion of new donors began as recurring givers.
This adds important context to what we're seeing in Zeffy's data: the average number of donations varies significantly by cause, but every additional donation represents more stable support for your mission. Even small improvements in donor retention can have a big impact on your organization's financial sustainability.
And if you can figure out a way to improve donor retention rates and increase your average number of donations per donor? That's the million-dollar question.
Recurring giving doesn't work for everyone, but when it does, it can be a powerful way to build lasting relationships. Even small shifts in how new donors engage could have a big impact sector-wide.
How Zeffy Helps with Donor Retention
Zeffy is built to help you hold onto donors longer, without creating more work. Here’s how:
Zeffy helps you build loyalty, reduce admin work, and keep the support flowing, all 100% fee-free.
How We Got These Numbers
Our analysis covers all recurring donor transactions up to September 13, 2024. We only looked at donors with automatic, repeating gifts—these numbers don't include one-time donors.
We calculated the average number of donations made by recurring donors across different organization causes. This helps us compare all kinds of nonprofits, no matter how often their donors give.
We count unique donor transactions, so each donor (or each recurring donation series) is only counted once.
The data is summarized by organization cause (like Health, Education, etc.), but we don't split by specific donor ages, gift sizes, or organization sizes. This means the patterns you see represent averages across many organizations of different sizes and donor demographics.
Disclaimer:
The benchmark data presented reflects aggregated industry averages and is intended for general informational purposes only. Individual organization performance may vary due to numerous factors, including but not limited to mission focus, donor demographics, fundraising strategies, and external market conditions. Deviations from these benchmarks should not be interpreted as indicative of Zeffy’s platform performance or efficacy.


Cookie settings

We use cookies
We use cookies to improve your experience on our platform. By clicking “Accept all cookies”, you agree to the storing of cookies on your device to enhance site navigation, analyze site usage and assist in our marketing efforts.
