Fall Leads Giving—But Not for Everyone
Fall is the biggest giving season overall, but not every cause follows the same pattern.
We were curious: do all causes follow the same giving calendar? We dug into anonymized data from thousands of Zeffy transactions to find out. Some causes peak in fall. Others tell a different story. Here’s what the data reveals.


What We Looked At
We analyzed all giving activity—including donations, ticket sales, memberships, and other transactions—processed through Zeffy between January 1 and December 31, 2024.
To focus on established organizations, we only included nonprofits that were already active before the start of the year. Each transaction was assigned to a season based on the date:
- Winter: December to February
- Spring: March to May
- Summer: June to August
- Fall: September to November
We then grouped the data by cause to see how giving was distributed across seasons. The patterns below reflect the share of total annual giving for each cause.
All data is anonymized and aggregated. It’s not broken down by gift size, donor demographics, or organization size, so what you see here reflects broad trends across many different types of nonprofits.
Fall Leads Giving, But It Depends on Your Cause
Fall is the biggest giving season across all causes we analyzed, but some causes tell a very different story. While education and veteran-focused nonprofits see their strongest peaks in fall, other causes peak in winter, spring, or remain steady across the year.
Summer is generally slower, but a few causes hold steady or even rise. And winter brings a noticeable boost for certain types of organizations.
These aren’t “good” or “bad” patterns. They’re just typical rhythms that might help you spot opportunities or compare against your numbers.
How Giving Patterns Vary by Cause
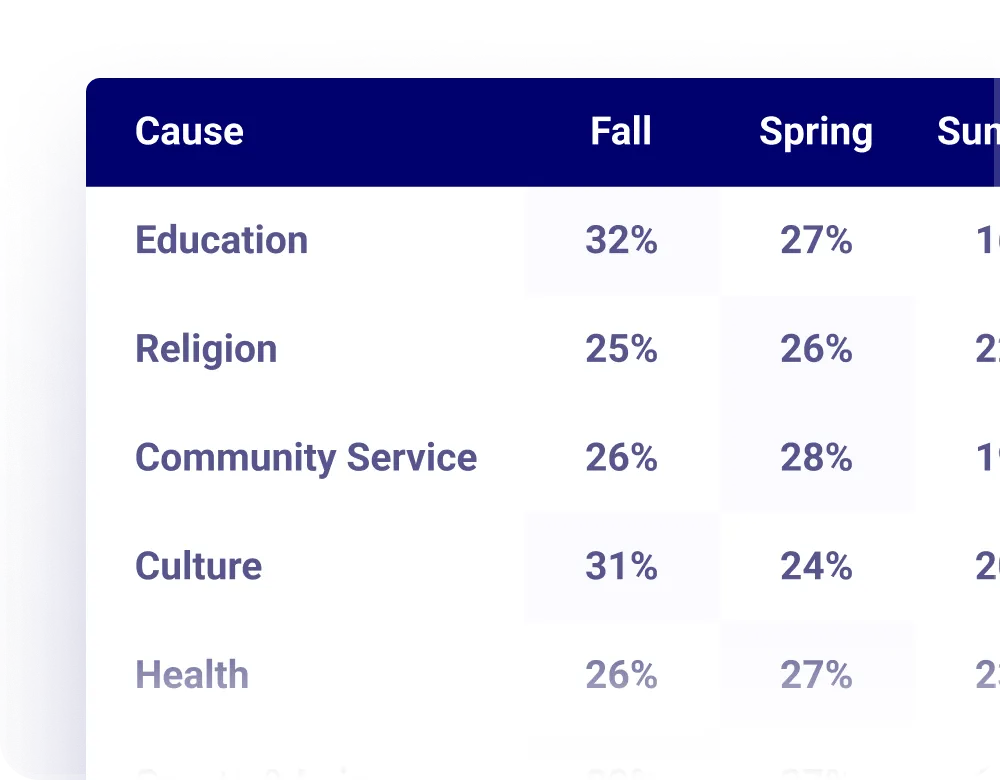
Here's how giving volume breaks down by season for different nonprofit causes:
Seasonal Giving by Cause: Percentage of annual giving by season, based on fundraising data from Zeffy in 2024.
When Giving Peaks for Your Cause
Giving patterns vary by cause. Some follow clear seasonal peaks, while others remain relatively stable throughout the year. Here are a few trends that stood out:
Fall leads several causes
Veterans (39%), education (32%), and student groups (32%) see their highest share of giving in the fall. This may reflect key moments in their annual cycle, such as back-to-school activities and year-end fundraising. Fall is also the busiest giving season overall—an important window for many campaigns.
Winter brings a boost for environmental organizations
Environment-focused nonprofits see their peak in winter (33%), which may reflect year-end giving patterns and seasonal campaign activity. Winter also brings a general year-end bump in giving across many sectors.
Religious orgs show year-round consistency
Donations to religious organizations remain relatively balanced throughout the year, with 25–27% of annual giving occurring in each season. Spring is also an important season for galas and fundraisers, particularly for cultural and faith-based organizations.
Animal welfare remains steady
Animal-focused organizations show consistent giving across all four seasons, including summer, an uncommon pattern compared to many other causes.
Summer tends to be slower for most causes
Education (16%) and environment (17%) see lower giving during the summer months. However, animal welfare and some political causes maintain steadier giving. For organizations considering off-cycle campaigns, summer may offer opportunities to test new approaches with less competition for donor attention.
How to Use This Data
There’s no one-size-fits-all answer to campaign timing. But understanding when donors tend to give can help you:
- See if your giving patterns line up with others in your space
- Spot quieter months where your campaign could stand out
- Plan events or fundraising pushes with added confidence
- Bring seasonal data to board or team conversations
- Identify if off-peak seasons might present opportunities to test new approaches
Fall may be the busiest giving season, but your cause’s peak season might be different. Use these patterns as one more input when planning your next fundraising campaign.
A Note on Benchmarks
These numbers reflect aggregated donation activity from thousands of nonprofits using Zeffy. Every organization is different, and your patterns might look nothing like this.
That’s completely normal. Use this data as a reference, not a grade!
Disclaimer:
The benchmark data presented reflects aggregated industry averages and is intended for general informational purposes only. Individual organization performance may vary due to numerous factors, including but not limited to mission focus, donor demographics, fundraising strategies, and external market conditions. Deviations from these benchmarks should not be interpreted as indicative of Zeffy’s platform performance or efficacy.
What We Looked At
We analyzed all giving activity—including donations, ticket sales, memberships, and other transactions—processed through Zeffy between January 1 and December 31, 2024.
To focus on established organizations, we only included nonprofits that were already active before the start of the year. Each transaction was assigned to a season based on the date:
- Winter: December to February
- Spring: March to May
- Summer: June to August
- Fall: September to November
We then grouped the data by cause to see how giving was distributed across seasons. The patterns below reflect the share of total annual giving for each cause.
All data is anonymized and aggregated. It’s not broken down by gift size, donor demographics, or organization size, so what you see here reflects broad trends across many different types of nonprofits.
Fall Leads Giving, But It Depends on Your Cause
Fall is the biggest giving season across all causes we analyzed, but some causes tell a very different story. While education and veteran-focused nonprofits see their strongest peaks in fall, other causes peak in winter, spring, or remain steady across the year.
Summer is generally slower, but a few causes hold steady or even rise. And winter brings a noticeable boost for certain types of organizations.
These aren’t “good” or “bad” patterns. They’re just typical rhythms that might help you spot opportunities or compare against your numbers.
How Giving Patterns Vary by Cause
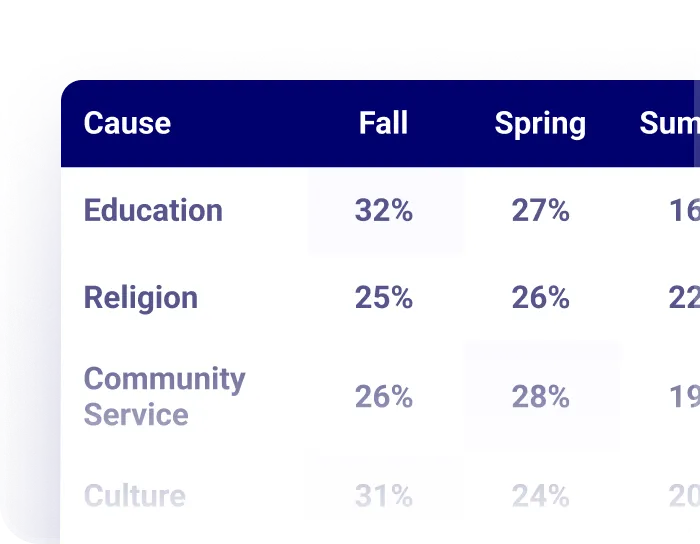
Here's how giving volume breaks down by season for different nonprofit causes:
Seasonal Giving by Cause: Percentage of annual giving by season, based on fundraising data from Zeffy in 2024.
When Giving Peaks for Your Cause
Giving patterns vary by cause. Some follow clear seasonal peaks, while others remain relatively stable throughout the year. Here are a few trends that stood out:
Fall leads several causes
Veterans (39%), education (32%), and student groups (32%) see their highest share of giving in the fall. This may reflect key moments in their annual cycle, such as back-to-school activities and year-end fundraising. Fall is also the busiest giving season overall—an important window for many campaigns.
Winter brings a boost for environmental organizations
Environment-focused nonprofits see their peak in winter (33%), which may reflect year-end giving patterns and seasonal campaign activity. Winter also brings a general year-end bump in giving across many sectors.
Religious orgs show year-round consistency
Donations to religious organizations remain relatively balanced throughout the year, with 25–27% of annual giving occurring in each season. Spring is also an important season for galas and fundraisers, particularly for cultural and faith-based organizations.
Animal welfare remains steady
Animal-focused organizations show consistent giving across all four seasons, including summer, an uncommon pattern compared to many other causes.
Summer tends to be slower for most causes
Education (16%) and environment (17%) see lower giving during the summer months. However, animal welfare and some political causes maintain steadier giving. For organizations considering off-cycle campaigns, summer may offer opportunities to test new approaches with less competition for donor attention.
How to Use This Data
There’s no one-size-fits-all answer to campaign timing. But understanding when donors tend to give can help you:
- See if your giving patterns line up with others in your space
- Spot quieter months where your campaign could stand out
- Plan events or fundraising pushes with added confidence
- Bring seasonal data to board or team conversations
- Identify if off-peak seasons might present opportunities to test new approaches
Fall may be the busiest giving season, but your cause’s peak season might be different. Use these patterns as one more input when planning your next fundraising campaign.
A Note on Benchmarks
These numbers reflect aggregated donation activity from thousands of nonprofits using Zeffy. Every organization is different, and your patterns might look nothing like this.
That’s completely normal. Use this data as a reference, not a grade!
Disclaimer:
The benchmark data presented reflects aggregated industry averages and is intended for general informational purposes only. Individual organization performance may vary due to numerous factors, including but not limited to mission focus, donor demographics, fundraising strategies, and external market conditions. Deviations from these benchmarks should not be interpreted as indicative of Zeffy’s platform performance or efficacy.


Cookie settings

We use cookies
We use cookies to improve your experience on our platform. By clicking “Accept all cookies”, you agree to the storing of cookies on your device to enhance site navigation, analyze site usage and assist in our marketing efforts.
