We use cookies to improve your experience on our platform. By clicking “Accept all cookies”, you agree to the storing of cookies on your device to enhance site navigation, analyze site usage and assist in our marketing efforts.
Cookies required for basic website functionality.
Cookies used to deliver content most relevant to you and your needs.
Cookies used to deliver content most relevant to you and your needs.
Cookies that help understand the performance of the website, how users interact with it and to identify bugs.
How is Zeffy free?
How is Zeffy free?
Zeffy relies entirely on optional contributions from donors. At the payment confirmation step - we ask donors to leave an optional contribution to Zeffy.
Verdict: Your org chart is only as useful as it is accurate — and most nonprofits are using the wrong structure for their size.
What works: Flat or simple hierarchical charts for small nonprofits (under 5 staff); functional structures for mid-size organizations (5–25 staff); matrix or divisional models for large nonprofits (25+).
What doesn't: Applying a complex matrix or divisional chart to a small team creates bureaucracy without benefit. Using a flat chart in a 40-person organization leads to leadership overload and reporting confusion.
Best for: Organizations that match their chart type to their actual headcount, mission type, and stage of growth — not what looks most professional on paper.
Worth considering if: Your current chart doesn't reflect how authority and communication actually flow, or if staff regularly don't know who to go to for decisions. The hierarchy section below will help you map roles before choosing a structure.
Whether you're starting a new nonprofit or restructuring an existing one, this guide shows you how to create an organizational chart that enhances team collaboration and operational effectiveness. Learn about different chart structures and implementation strategies that match your nonprofit's unique needs.
A nonprofit org chart is a visual representation of your organization's internal structure, showing the relationships between different levels and departments. It's a roadmap that outlines titles, responsibilities, and authority structure within your organization.
Your org chart depends on the scale and size of your nonprofit. Most nonprofits have a board of directors at the top with staff below, depending on their specific roles.
A well-defined and designed chart helps you in the following ways:
Allows open communication: The chart shows the reporting structure and organization workflow, which helps people communicate and work together.
Streamlines decisions: It clarifies decision-making power to identify the right people to reach when you need answers or approvals.
Fosters accountability: It shows hierarchy within the organization. Defines roles and responsibilities for employees, board members, and volunteers to prevent confusion and ensure accountability.
Facilitates onboarding: A well-structured chart simplifies the onboarding process to provide new joiners with a clear understanding of nonprofit organizational structure.
Boosts transparency: Donors, volunteers, and partners can understand how the organization is structured to promote trust and credibility in your organization.
What are the key elements of a nonprofit organizational chart
1. Governance
The board of directors forms the governing body of a nonprofit, providing strategic and financial oversight to ensure smooth functioning. Board members determine which programs will be funded for the year. They also ensure the organization abides by its bylaws and offer fundraising support.
The size of your board depends on federal and state requirements, but most laws require nonprofits to have at least three members on the board.
Governance provides oversight, but it's the administration that manages your operations. They develop the nonprofit's strategic plan, annual budget, and fundraising initiatives for the year. The key figure in this structure is the Executive Director, who reports to the nonprofit board.
Other key roles within the administration include chief financial officer, development director, marketing executive, and more.
3. Programs
Your program teams directly execute your nonprofit's mission through service delivery and community engagement. This section of your org chart should clearly outline the roles of program managers, coordinators, and specialists responsible for implementing initiatives.
Include both permanent programs and temporary project teams to showcase your full operational scope.
Most nonprofits — regardless of size or mission — operate within a recognizable hierarchy that flows from governance at the top down to the volunteers delivering programs on the ground. Understanding what each role actually does (and where authority begins and ends) is essential before you can design an org chart that reflects how your organization truly works.
Here's how the standard nonprofit hierarchy breaks down.
Board of Directors
The board sits at the top of every nonprofit org chart because it holds ultimate legal and fiduciary responsibility for the organization. Board members set strategic direction, approve the annual budget, hire and evaluate the Executive Director, and ensure the nonprofit remains compliant with its mission and legal obligations.
Within the board, three roles carry specific authority:
Board Chair — Leads board meetings, sets the governance agenda, and serves as the primary liaison between the board and the Executive Director.
Treasurer — Oversees financial reporting, monitors budget performance, and chairs the finance committee. In smaller nonprofits, this role is often the first line of financial accountability.
Secretary — Maintains official records, meeting minutes, and ensures proper documentation of board decisions. This documentation is critical for audits and legal compliance.
Executive Director (ED)
The Executive Director is the bridge between the board's vision and the organization's day-to-day reality. Appointed by the board, the ED translates strategic goals into operational plans, manages senior staff, oversees fundraising and program outcomes, and represents the organization publicly.
In smaller nonprofits, the ED often handles responsibilities that larger organizations distribute across an entire leadership team. That's not a structural flaw — it's a reality worth reflecting accurately in your org chart rather than papering over with titles that don't match actual workloads.
Senior Leadership & Department Directors
Directly below the ED, this layer includes roles that lead functional areas of the organization. Common positions include:
Chief Operating Officer (COO) — Manages internal operations, HR, and administrative systems so the ED can focus on external strategy and fundraising.
Chief Financial Officer (CFO) / Finance Director — Handles accounting, financial controls, grant compliance, and financial reporting to the board.
Development Director — Leads all fundraising efforts, including individual donor campaigns, grant applications, corporate partnerships, and major gift cultivation.
Program Director — Oversees the design, delivery, and evaluation of the nonprofit's core programs. This role is often closest to the mission impact data the board needs.
Communications / Marketing Director — Manages brand, messaging, donor communications, and public relations.
Not every nonprofit will have all of these roles. In lean organizations, one person may wear several hats simultaneously. Your org chart should show the structure as it actually exists, not as you'd ideally like it to look on paper.
Managers and Program Staff
Managers sit between directors and front-line staff, translating department-level goals into individual work plans and supervising daily operations. Program managers, development managers, and operations managers fall into this tier. Their effectiveness often determines whether strategic plans actually get executed — which is why their position in the org chart matters more than it might seem.
Front-line program staff are where mission delivery actually happens. They run the workshops, distribute the resources, build the community relationships, and generate the impact data that flows back up through the hierarchy. An org chart that doesn't accurately represent this layer can leave staff feeling invisible and leadership operating without a clear picture of capacity.
Volunteers and Volunteer Coordinators
Volunteers are unique to the nonprofit structure. They represent significant organizational capacity but require intentional management to deploy effectively. A Volunteer Coordinator recruits, trains, schedules, and retains volunteers, ensuring they're placed where they add the most value. In volunteer-heavy organizations, this role can be as operationally critical as any paid position.
Many nonprofits make the mistake of leaving volunteers entirely off their org charts. That's a missed opportunity. Showing where volunteers fit — and who manages them — communicates organizational seriousness to funders, partners, and prospective volunteers alike.
The way these roles interact — who reports to whom, who has decision-making authority, and where collaboration is required — is exactly what your org chart should make visible. If your current chart doesn't reflect these relationships accurately, the sections below will help you choose a structure that does.
6 different types of organizational charts for nonprofits
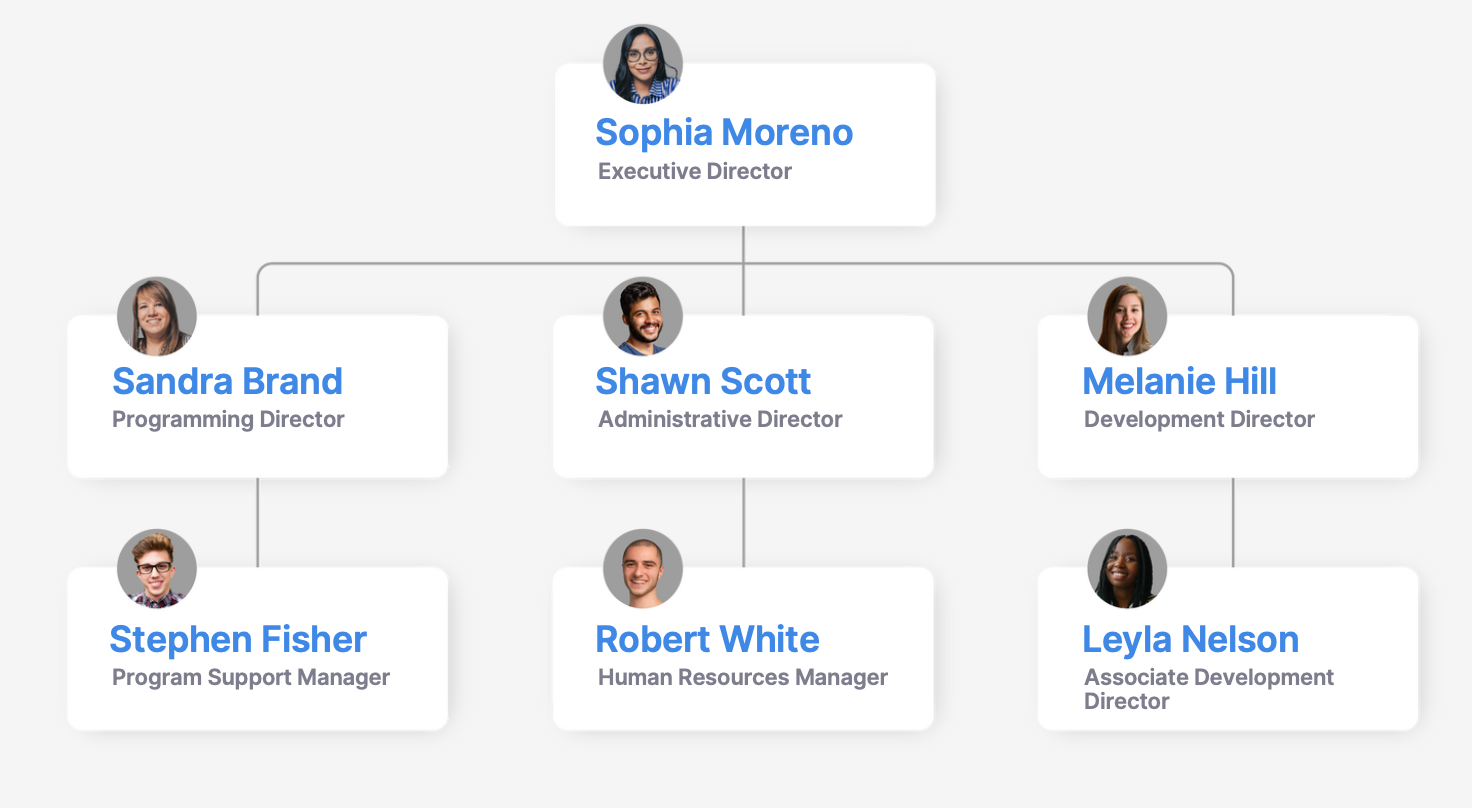
1. Hierarchical org chart
The hierarchical structure follows a clear top-down authority flow, with the board of directors and executive leadership at the top.
Each subsequent level reports to the one above, creating distinct management layers from department heads to program staff. This traditional pyramid structure clearly defines reporting relationships and decision-making authority.
Pros
Simple structure that is easy to understand and put in place
Follows a clear chain of commands and provides clarity on reporting relationships
Cons
Creates communication barriers between levels
Difficult to show cross-functionality as you can't explain how teams join forces or share tasks across the org
2. Flat org chart
This chart is the opposite of a hierarchical one with fewer management levels, as most members report to the top leaders at the same level. The top-level management is at the center of the chart. The rest of the roles are built horizontally from there.
Everyone tends to share more responsibility and authority compared to a hierarchical structure.
Pros
Encourages open communication and more collaboration between staff
Empowers self-management and stronger decision-making ability for every employee
Cons
Without clear authority levels, it can be unclear who handles certain tasks or decisions
Executives can get overwhelmed as they have to manage more people without middle managers to help
3. Functional org chart
A functional organizational chart structures a nonprofit based on specific departments or functions. These include fundraising, marketing, human resources, finance, and more.
The nonprofit organizational structure starts with senior management at the top, then department heads and their respective team. The structure shows who handles what area within the nonprofit, making reporting and management easier.
Pros
Streamlines decision-making with different functional areas of an organization
Facilitates specialization and defines a clear chain of command
Cons
Lack of cross-department collaboration and communication
Departments can develop their priorities, leading to conflicts between teams
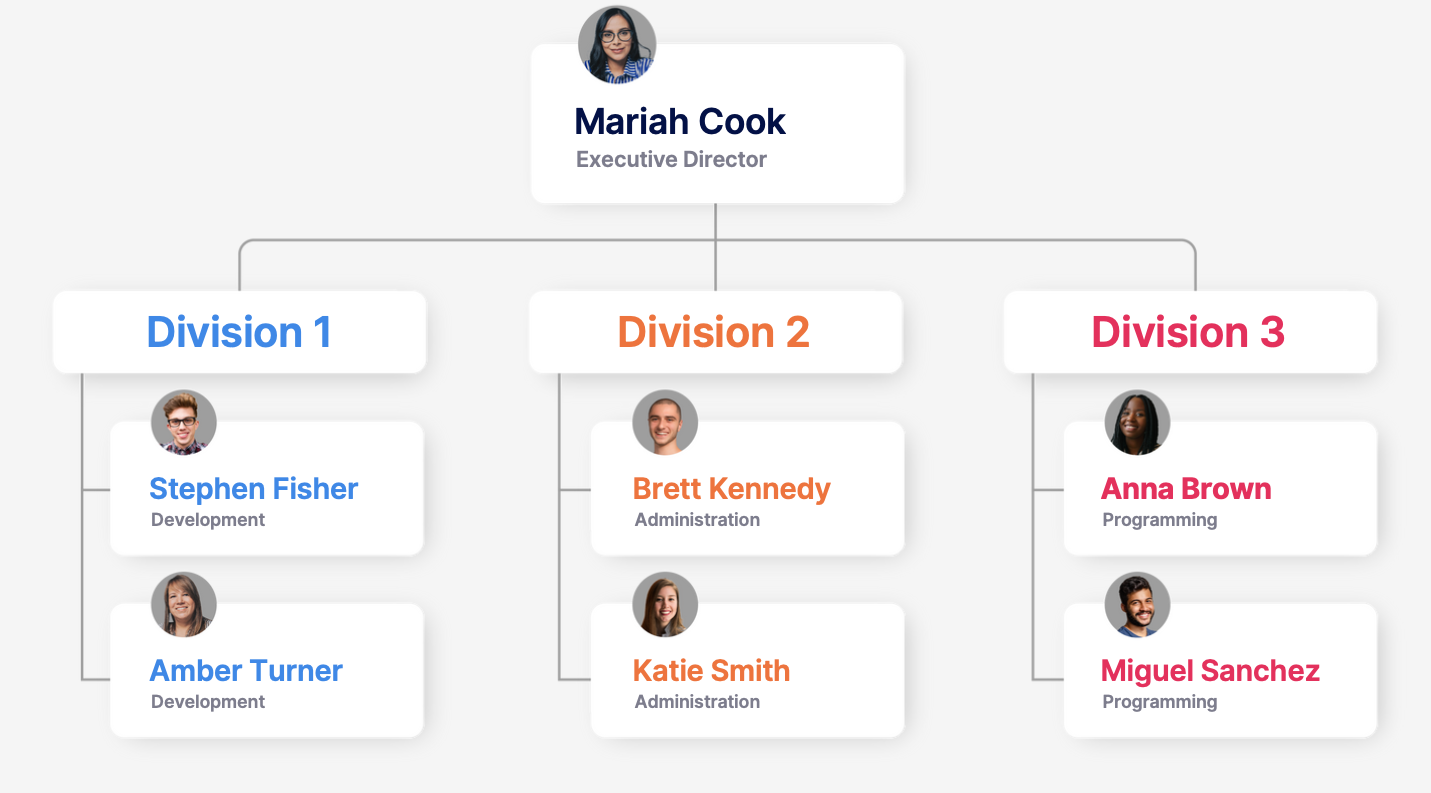
4. Divisional org chart
The divisional organizational chart structures your nonprofit into separate divisions or units based on their programs, projects, or geographic regions. Each works independently with its own departments and leaders, while the division head reports to the executive director or board.
It's like having mini-organizations within the nonprofit, where each division has a separate role but aims to extend the impact of its mission. This structure helps the organization focus on specific regions or areas.
Pros
Each division focuses on a specific area that leads to better outcomes and results
Greater autonomy and quick decision-making with divisions
Cons
Divisions can have similar departments like finance or marketing, leading to unnecessary duplication and higher costs
With each division working independently, it is hard to maintain consistent policies
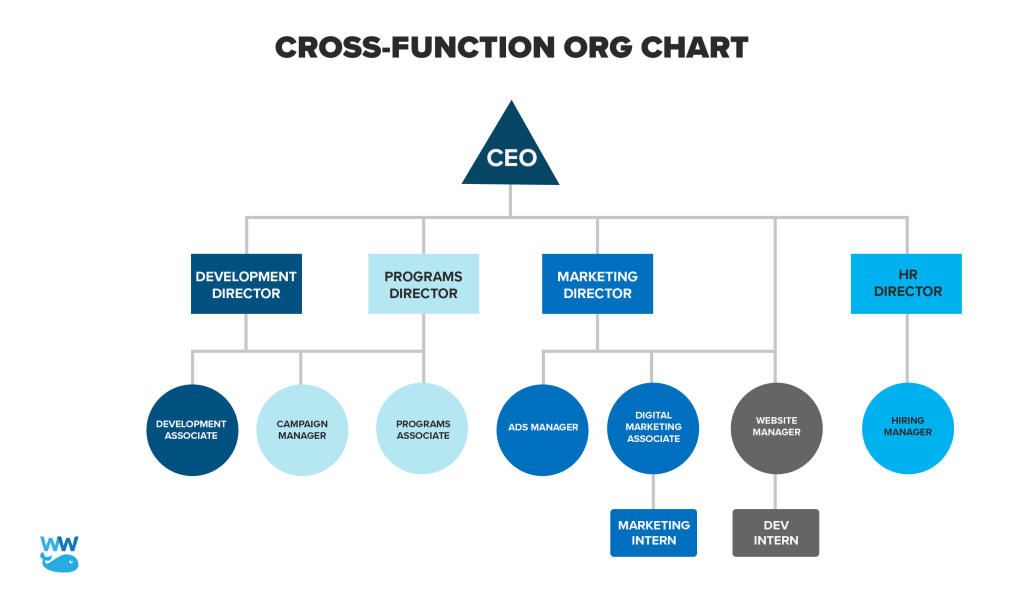
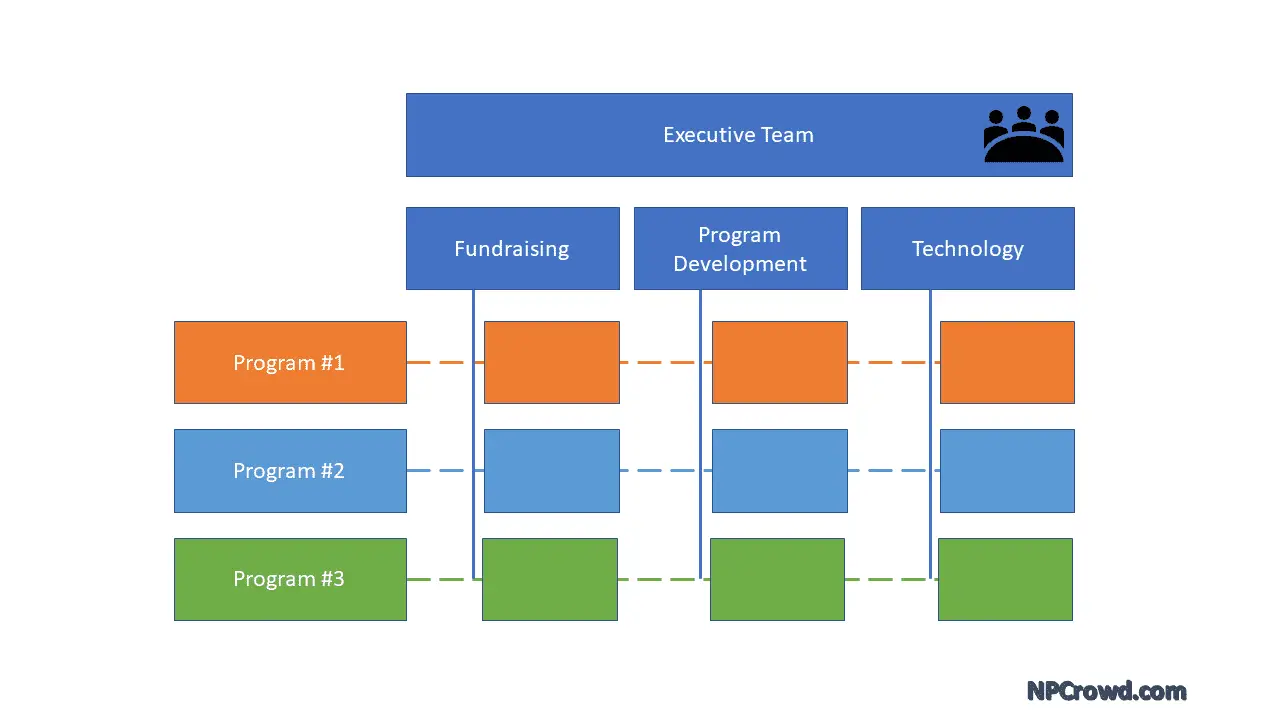
5. Matrix org chart
The matrix design maps functional departments horizontally across the top while listing specific programs or projects vertically. Staff members appear at intersections where their roles connect with both functional areas and program responsibilities.
Pros
Employees from different departments work together, leading to shared expertise
Makes resource allocation easier across different areas in a nonprofit
Cons
Having many managers can create confusion about who to follow and report to
Managers may have different goals, leading to conflicts between teams or departments
6. Round org chart
The round organizational chart places leadership at the center, with teams radiating outward in concentric circles. This design emphasizes collaborative relationships while maintaining clear reporting structures, showing how all roles support the organization's core mission.
Pros
Encourages teamwork by showing that everyone is connected and part of a unified system
Emphasizes equality, making employees feel more involved and valued
Cons
Unclear chain of command makes it hard to know who handles which tasks or choices
With everything seemingly connected, communication paths can become tangled
How to choose the right nonprofit organizational structure
Knowing the six chart types is only half the equation. The harder question is which one actually fits your organization right now, given your size, your stage of growth, and the nature of your mission. Getting this wrong costs you: the wrong structure creates reporting confusion, slows decisions, and frustrates staff who don't know where they fit.
Here's how to think through the decision.
Match your structure to your size and lifecycle
Your organization's headcount and maturity are the fastest filters for narrowing down chart options.
Small nonprofits (fewer than 5 staff) are typically founder-led, with most people wearing multiple hats. A flat or simple hierarchical chart fits best here. There aren't enough layers to justify functional divisions, and too much structural complexity creates bureaucracy without benefit. The ED is usually managing everyone directly, and the board plays a more hands-on operational role.
Mid-size nonprofits (5 to 25 staff) have enough specialization to benefit from a functional structure, where departments like fundraising, programs, and finance each have a clear lead. The challenge at this stage is cross-department coordination — the functional structure supports specialization but can create silos if you're not deliberate about communication across teams.
Large nonprofits (25 or more staff) often need a matrix or divisional model. A divisional structure makes sense if your programs operate in distinct geographic regions or serve clearly different populations. A matrix structure works when staff need to contribute to multiple programs simultaneously while still belonging to a functional department. At this scale, a purely hierarchical chart becomes unwieldy and slows decision-making.
Factor in your mission type
Your mission isn't just what you do — it shapes how your organization needs to be structured to do it well.
A direct service organization (food bank, shelter, health clinic) typically needs a clear program management hierarchy with strong operational controls. A functional or hierarchical chart keeps accountability clear when you're managing high-volume service delivery.
A policy or advocacy organization often benefits from a flatter structure, where teams need to move quickly and collaborate across issue areas. Rigid reporting lines can slow the kind of cross-functional work advocacy requires.
A federated or chapter-based organization — operating across multiple cities or regions — almost always needs a divisional model to give each chapter sufficient autonomy while maintaining central governance and brand consistency.
Use this comparison table to guide your decision
Structure
Best for
Staff size
Key strength
Watch out for
Hierarchical
Traditional nonprofits with clear program areas
Any size
Clear chain of command
Communication bottlenecks
Flat
Early-stage, founder-led orgs
Under 10
Fast decisions, open culture
Leadership overload as you grow
Functional
Established orgs with distinct departments
10-50
Specialization and efficiency
Department silos
Divisional
Multi-program or multi-region orgs
25+
Program focus and autonomy
Duplication of functions
Matrix
Complex orgs with shared staff across programs
20+
Resource flexibility
Reporting confusion
Round
Collaborative, mission-centered cultures
Any size
Sense of equality and connection
Unclear authority
The right structure isn't permanent. Many nonprofits start with a flat chart, shift to functional as they add staff, and eventually adopt elements of a matrix model as programs multiply. Your org chart should reflect where you are now — with room to evolve.
Real-world nonprofit org chart examples
Understanding chart types in the abstract is useful. Seeing how they play out in real organizations is more useful. Below are three representative examples — small, mid-size, and large — showing how structure scales and why each organization made the choices it did.
Example 1: Small community nonprofit — flat structure
How it looks: The Executive Director sits at the top. Directly below, on the same horizontal level, are a Programs Coordinator and a Development & Outreach Coordinator. Volunteers are shown as a shared resource beneath both coordinators, managed by whoever is running operations that week.
Why it works: With only three paid staff members, a flat chart is the only structure that accurately reflects how the organization operates. Everyone contributes to fundraising, everyone touches programming, and the ED makes most decisions directly. A hierarchical chart with multiple layers would misrepresent a reality where all three staff members interact daily and the formal chain of command rarely needs to be invoked.
What to watch for: As volunteer numbers grow, the absence of a dedicated Volunteer Coordinator creates a capacity gap. The flat chart should be revisited when staff headcount crosses five, because the ED's span of control becomes unmanageable without at least one middle layer.
Example 2: Mid-size regional nonprofit — functional structure
Organization type: Regional workforce development nonprofit, 18 staff, operating across three counties
Structure used: Functional
How it looks: The Executive Director reports to the Board of Directors. Below the ED, four department heads lead distinct functional areas: Programs Director, Development Director, Finance Manager, and Operations & HR Manager. Each department head supervises two to four staff members focused on their functional area. A Volunteer Coordinator sits within the Programs department.
Why it works: At 18 staff, this organization has enough specialization to benefit from clear department boundaries. The Development Director can focus entirely on grant writing and donor relations without also managing program logistics. The Finance Manager can maintain financial controls without operational responsibilities bleeding in. The functional structure enables each department to build expertise and accountability within its lane.
What to watch for: Cross-department collaboration — particularly between Programs and Development — requires deliberate coordination. The org chart doesn't show the informal communication channels that keep these teams aligned. Many mid-size nonprofits at this stage benefit from adding a brief collaboration protocol alongside the chart to address this gap.
Example 3: Large national nonprofit — matrix structure
Organization type: National youth mentorship organization, 75 staff, operating in 12 cities
Structure used: Matrix
How it looks: Functional departments (Programs, Development, Finance, Communications, HR) run horizontally across the top of the chart. Regional program divisions (Northeast, Southeast, Midwest, West) run vertically down the left side. Staff members appear at the intersections — a Regional Program Manager in the Midwest, for example, reports both to the national Programs Director for programmatic guidance and to the Regional VP for operational decisions within their geography.
Why it works: At this scale, staff need to contribute to both their functional discipline and their regional division simultaneously. A purely hierarchical chart would force false choices about where people sit. The matrix makes dual accountability explicit and gives both functional and regional leadership clear visibility into how staff time is allocated.
What to watch for: Matrix structures require strong communication infrastructure to prevent reporting confusion. Staff with two managers — one functional, one divisional — need explicit clarity about who makes which decisions (HR matters, performance reviews, project prioritization). Organizations using a matrix chart typically supplement it with a RACI chart or decision-rights framework to prevent authority gaps.
These three examples illustrate a consistent principle: the right structure isn't the most sophisticated one — it's the one that most accurately represents how your organization actually makes decisions and delivers its mission.
Emerging and non-traditional nonprofit structures
The six chart types covered above represent how most nonprofits are structured. But they're not the only options — and for some organizations, they're not even the best ones. A growing number of nonprofits are adopting alternative governance and leadership models that better match their values, their communities, or the way their work actually gets done.
Co-leadership and shared executive models
In a co-leadership model, two or more people share the Executive Director role with equal authority. This structure works well for organizations that want to distribute power intentionally, prevent burnout at the top, or bring complementary skill sets (program expertise paired with development expertise, for example) into executive leadership simultaneously.
Co-leadership requires explicit agreements about decision-making authority, communication protocols, and how disagreements get resolved. Without those agreements documented, shared leadership can create the same confusion it's meant to avoid. When it works, though, it builds organizational resilience — the loss of one leader doesn't destabilize the whole organization.
Worker self-direction and staff-governed models
Some nonprofits — particularly those rooted in social justice or labor movements — operate with worker self-direction, where staff collectively govern the organization rather than reporting through a traditional hierarchy. In these models, teams make decisions together, leadership rotates, and the board may include staff representatives with voting authority.
This model demands significant investment in group decision-making skills and conflict resolution capacity. It's not suited to every mission or culture. But for organizations where the people delivering services are also the people most affected by the mission, it can create powerful alignment between values and operations.
Fiscal sponsorship
Fiscal sponsorship isn't an org chart structure in the traditional sense — it's a legal and financial arrangement where an established 501(c)(3) nonprofit sponsors a project or emerging organization, allowing it to receive tax-deductible donations without incorporating separately.
For new or small programs that aren't ready to build out a full organizational structure, fiscal sponsorship provides immediate operational infrastructure. The sponsored project operates within the sponsor's legal entity, which means the sponsor's governance structure applies. This is worth understanding because it affects how you'd represent the project on an org chart — the project lead typically reports into the fiscal sponsor's leadership rather than operating as a fully independent entity.
Networked and collaborative structures
Some nonprofits operate less like traditional organizations and more like coordinating hubs within a network of partner organizations, community groups, and contractors. In these models, the org chart looks less like a pyramid and more like a web — the central staff team is small, but their reach is amplified through formal and informal partnerships.
This structure is increasingly common in collective impact work, place-based initiatives, and backbone organizations. If your nonprofit operates this way, a standard hierarchical chart will misrepresent how your work actually gets done. A network map or stakeholder diagram often serves these organizations better than a traditional org chart.
Understanding these emerging models matters even if you don't adopt them. As your organization grows and your community of staff and volunteers changes, you may find that elements of shared leadership or networked collaboration strengthen what you're already doing.
Legal and compliance considerations for nonprofit structure
Your org chart isn't just an internal planning tool. It has real legal implications. The structure you put on paper — and the governance you actually practice — must align with your Articles of Incorporation, your bylaws, and IRS expectations for 501(c)(3) organizations. Misalignment between what your documents say and how you actually operate is one of the most common compliance problems nonprofits face.
Articles of Incorporation
Your Articles of Incorporation are filed with your state and serve as your nonprofit's founding legal document. They typically name the initial board members, define the organization's purpose, and specify basic governance parameters. If your org chart reflects a leadership structure that contradicts what's in your Articles — for example, showing a single-member board in a state that requires at least three — you have a compliance problem that needs to be resolved at the document level, not just on the chart.
State-specific board minimums
Every state has its own requirements for nonprofit board composition. Most require a minimum of three board members. Some states specify that certain officer roles (President, Treasurer, Secretary) must be held by separate individuals rather than one person wearing multiple hats. Before finalizing your governance structure, check your state's nonprofit corporation act. Your org chart should reflect a board composition that actually meets your state's legal minimums.
IRS expectations for 501(c)(3) governance
The IRS doesn't prescribe a specific org chart format, but it does expect 501(c)(3) organizations to operate with independent governance. That means the board should have genuine oversight authority over the Executive Director — not just on paper, but in practice. The IRS looks at whether your board has conflict-of-interest policies, whether compensation decisions are made independently, and whether the board exercises real financial oversight.
Your Form 990 asks detailed questions about governance structure: whether the organization has a written conflict-of-interest policy, whether the board reviews the 990 before filing, and whether the ED or family members have business relationships with the organization. These aren't just disclosure questions — they signal to the IRS and to the public how seriously you take governance. Your org chart should reflect the structure that makes these policies operable.
Bylaws alignment
Your bylaws are your internal governing document. They define how the board is structured, how officers are elected, what quorum looks like for board votes, and how the organization handles major decisions like hiring or removing the Executive Director. If your operational org chart shows a structure that doesn't match your bylaws — for example, a COO role with executive authority that your bylaws don't recognize — you've created ambiguity that can create legal risk during leadership transitions or disputes.
Review your bylaws any time you make a significant structural change to your organization. It's worth having legal counsel confirm that your governance structure, your org chart, and your founding documents are all telling the same story. The nonprofit bylaws template on Zeffy's blog is a useful starting point if yours need updating.
Free nonprofit org chart templates
You don't need to build your org chart from scratch. The right template gives you a clear starting point you can customize in minutes — and gets your structure documented before it exists only in people's heads.
Here are three free options worth bookmarking:
Canva offers a range of nonprofit org chart templates you can edit directly in your browser. You can add your own colors, logos, and role titles without any design experience. Canva for Nonprofits also offers free access to premium features — learn more about Canva for Nonprofits on the Zeffy blog.
Google Slides or Google Drawings let you build a shareable, editable org chart that lives in Google Drive and stays accessible to your whole team. Use the shapes and connector tools in Google Drawings to build a clean hierarchical or functional chart, then share via link.
Lucidchart offers a free tier with org chart templates specifically designed for nonprofits. You can drag and drop role boxes, add photos, and export to PDF or PNG when you're ready to share with staff or post in your knowledge base.
Whichever tool you choose, save a living version your team can update as roles change — and a static PDF snapshot for onboarding packets and board presentations. An org chart that's only current on the day it was made loses most of its value within a year.
How to create a nonprofit organizational chart
1. Outline key roles and departments
The first step is to clearly understand how your nonprofit runs. You should know who holds leadership positions and the different departments that make up your organization. This will help you create an organizational chart that reflects your true structure.
Start by creating a list of those at the higher level, like board directors and executives. Write down your organization's primary departments or functions, including marketing, operations, finance, and human resources. Then, define the positions within each of these, including their responsibilities.
2. Define reporting lines and hierarchy
Start by mapping your nonprofit's core reporting relationships, beginning with the board's oversight of the executive director. Document both direct supervisory relationships and cross-functional collaborations that drive program success.
Create clear distinctions between strategic leadership roles and operational management positions while highlighting important interdepartmental connections that support mission delivery. Your chart should make decision-making pathways instantly clear to every team member.
3. Choose the right chart structure
Pick an org chart style that fits your organization's structure, size, and departments.
A hierarchical or flat-down chart is best for small or new nonprofits with limited roles. Large organizations with many departments might use a functional chart. If you work globally, a matrix or division chart could work best.
Whichever chart you choose, it should clearly define the roles and reporting relationships.
4. Design the nonprofit organizational structure
Professional organizational charts require the right digital tools for clarity and easy updates. Choose a platform that allows easy sharing and quick updates to maintain accuracy.
Some common options include:
Canva: The online design platform offers free and paid templates for organizational charts. You can edit them to fit your organization's branding.
Airtable: Airtable allows you to create a custom org chart and make it accessible online to everyone on your team.
Microsoft Office: Microsoft Word, PowerPoint, and Excel all come with org chart illustrations.
5. Make it accessible and review it
Integrate your organizational chart into your nonprofit's central knowledge management system. Host it on cloud platforms like Google Drive or SharePoint for universal team access.
Schedule quarterly reviews with department heads to capture role changes, new positions, and evolving reporting relationships. Include the latest version in onboarding materials and team communications to maintain organizational clarity.
Best practices to follow when designing nonprofit organizational charts
1. Add relevant information
A detailed org chart is key in remote or hybrid work environments — include each person's name, job title, and contact info. This helps team members know who to contact when they need help. With this info, staff can find the right person to talk to about any issue or question.
2. Use different colors and shapes
When making your chart, use different shapes and colors to identify departments and levels clearly. Try one shape for directors, another for department heads, and a third for other staff.
Use different colors for each department or main job function. These visual cues make it easy for each member to navigate the chart and understand where they fit within the organization.
3. Limit the amount of arrows and symbols
Your organizational chart isn't simply a visualization or map of your nonprofit's structure. Its purpose is to highlight the reporting relationships and help employees work more efficiently. Make sure that it is as clear as possible.
Reduce the number of different symbols and arrows or connecting lines that you add. Too many lines can make your chart overwhelming and confusing to navigate.
4. Train staff on the use of the org chart
Every member of your nonprofit should know how to access and use the org chart.
Provide training on the selected org chart structure and how it relates to their specific role to develop a shared understanding of your nonprofit structure.
Understanding reporting relationships is essential for effective collaboration and decision-making across the organization. This knowledge ensures team members can navigate internal processes efficiently while maintaining clear accountability.
Final words on nonprofit org charts
A good org chart does more than map reporting lines. It forces you to name who owns what: programs, operations, finance, and fundraising. That clarity is how small teams stretch their time and their dollars further.
When fundraising lives on your chart, the tools behind that role decide how much reaches your mission. Keep every dollar you raise with Zeffy, the 100% free fundraising platform trusted by 100,000+ nonprofits to raise $2B+. No platform, transaction, or credit card fees.
A nonprofit must update its organizational chart whenever major changes occur in leadership, staff, or structure. This includes new hires, people leaving, promotions, board changes, or major reshuffling.
It's best to review and update the chart at least annually to ensure accuracy and alignment with current roles and responsibilities. Maintaining an updated organizational chart prevents misalignment in decision-making processes and strengthens operational efficiency. This clarity helps teams collaborate more effectively while reducing confusion about roles and responsibilities.
Reporting relationships define who each team member reports to and who oversees their work. In nonprofits, these relationships ensure clear lines of accountability, streamline decision-making and enhance communication.
A well-structured org chart helps employees understand their role within the organization and how their work contributes to its mission.
Three documents need to match your actual governance structure: your Articles of Incorporation, your bylaws, and your IRS Form 990. If your chart shows a leadership structure that contradicts any of these, you have a compliance gap. Review all three any time you make significant structural changes to your organization.
Yes — and many do. A large nonprofit might use a divisional structure to show program areas, while using a matrix chart to show how shared staff are deployed across those divisions. What matters is that your chart accurately reflects how authority and communication actually flow in your organization, not that it fits neatly into one category.
Both minimize traditional hierarchy, but they communicate it differently. A flat chart shows most roles at the same horizontal level beneath leadership. A round chart places leadership at the center with roles radiating outward in rings. The round format emphasizes mission-centeredness and collaboration. The flat format emphasizes shared responsibility and reduced management layers. Neither works well for large organizations with complex reporting structures.
Get weekly fundraising tips from nonprofits experts
Thank you! Your submission has been received!
Oops! Something went wrong while submitting the form.
Keep reading :
Nonprofit guides
Ultimate Guide to Nonprofit Board Responsibilities
Discover the key responsibilities of a nonprofit board and how they shape the organization's success. Learn about key roles, legal duties, and essential insurance coverage.
Nonprofit Board President Responsibilities: Duties, Skills & Job Template (2026)
Uncover the nonprofit board president's responsibilities and essential skills, from leadership duties to ensuring the organization's mission is fulfilled.
Look for people who attend related events, follow relevant Facebook groups, or subscribe to aligned newsletters.These aren’t just potential donors—they’re your future advocates.
Look for people who attend related events, follow relevant Facebook groups, or subscribe to aligned newsletters.These aren’t just potential donors—they’re your future advocates.


.webp)

